
REDUNIQ Insights
Analytical data to support the growth of your business!
O REDUNIQ Insights is a knowledge solution that aims to make analytical information available to its clients, based on national retail information, supporting companies in the generation of new business strategies. insights in making business development decisions.
A REDUNIQ, the largest national and foreign card acceptance network in Portugal (having transacted 27.1 billion euros in purchases in 2022, totalling 801 million transactions) has detailed information on the consumption profiles carried out in establishments served by its network.

Choose the right infographic or report for your business
Free infographic
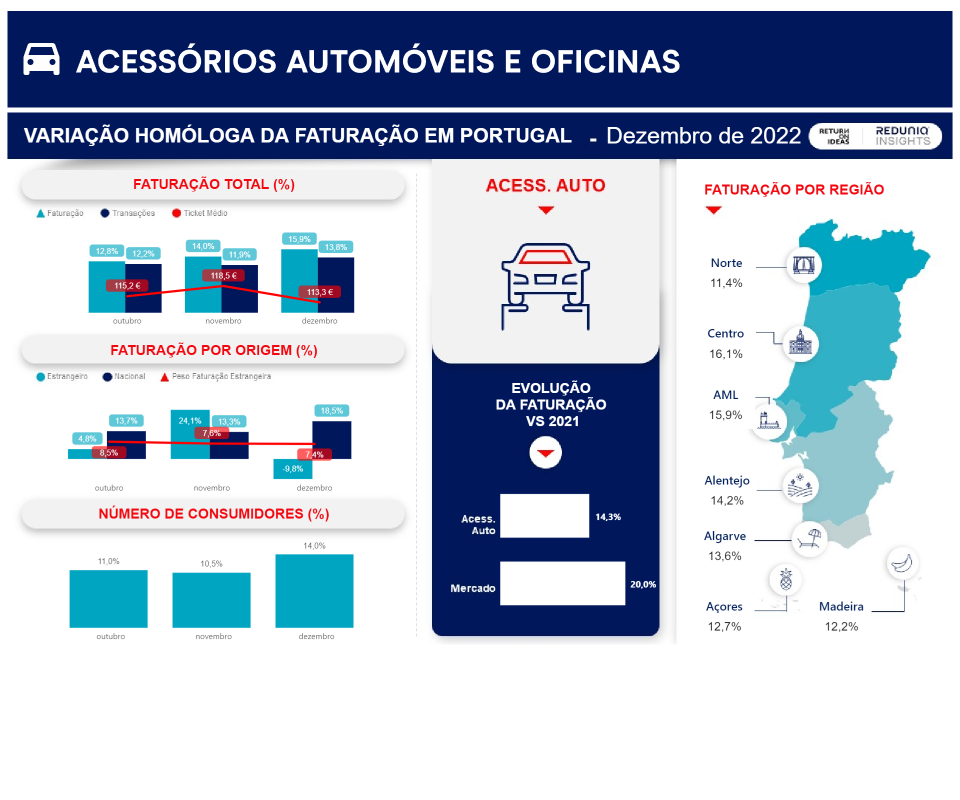
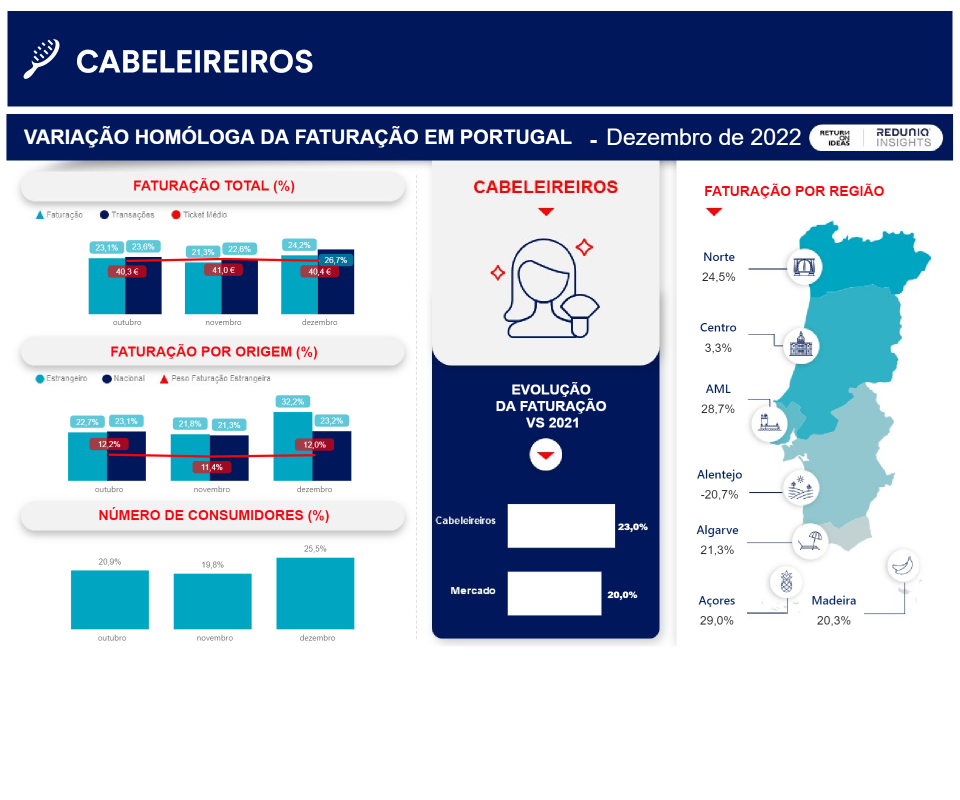
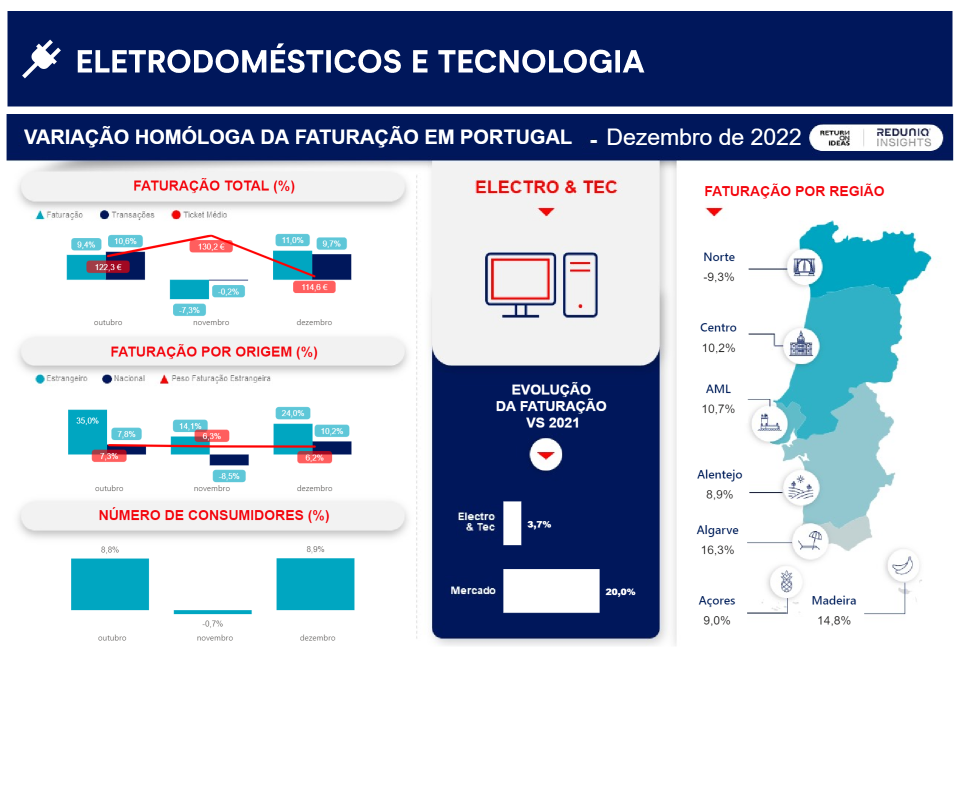
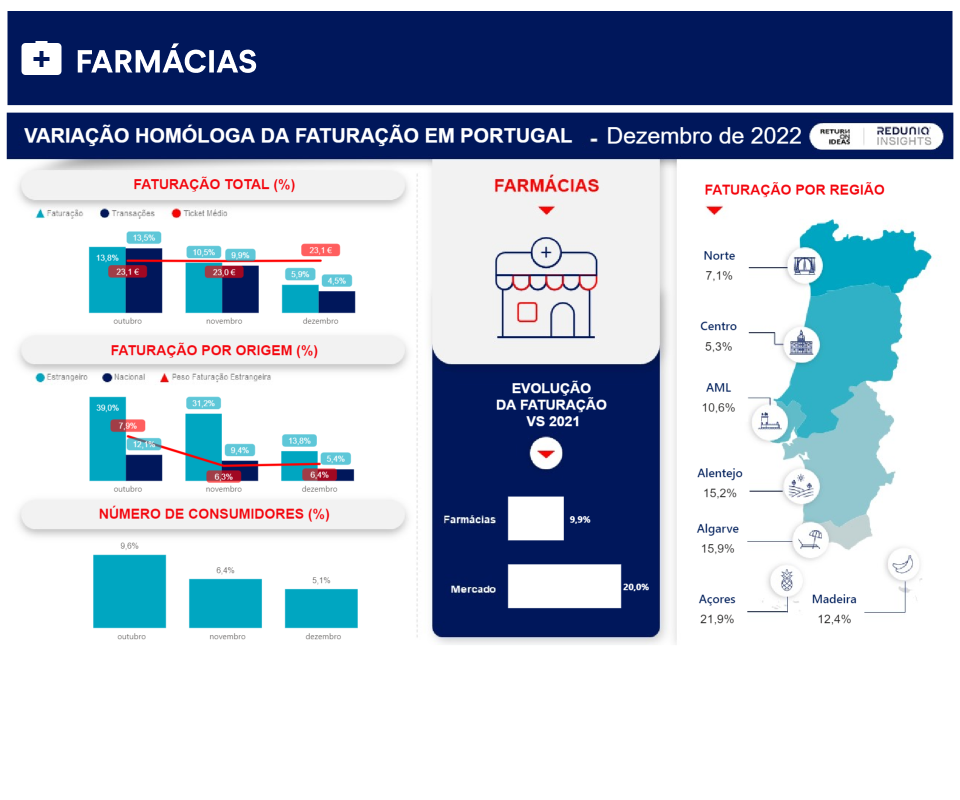
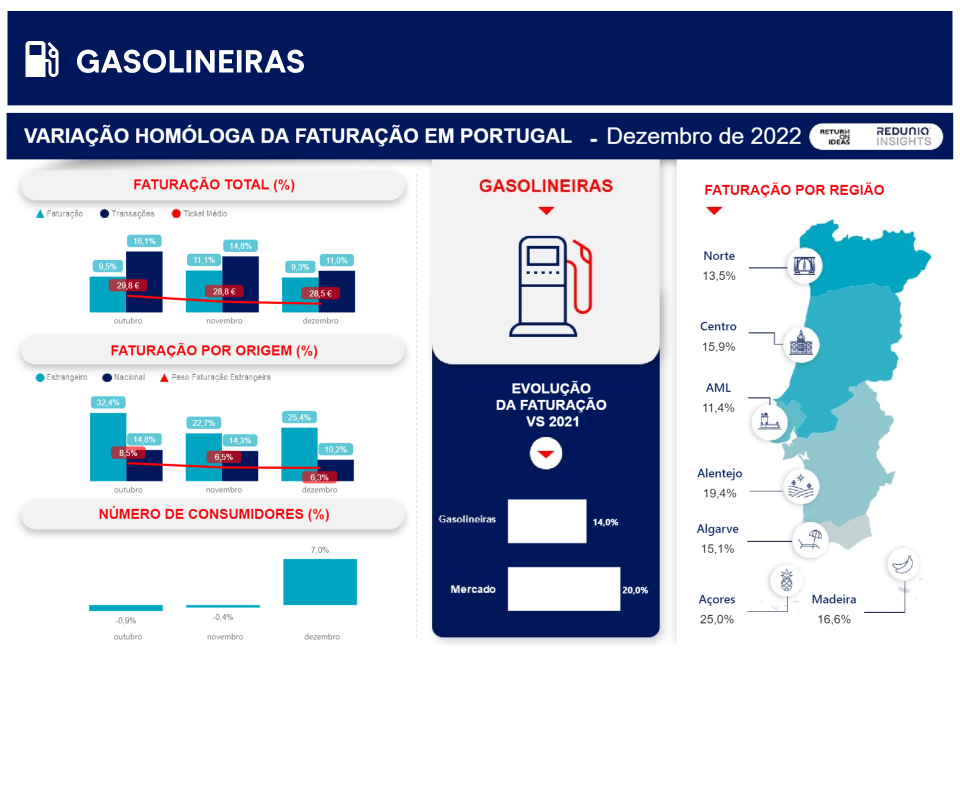
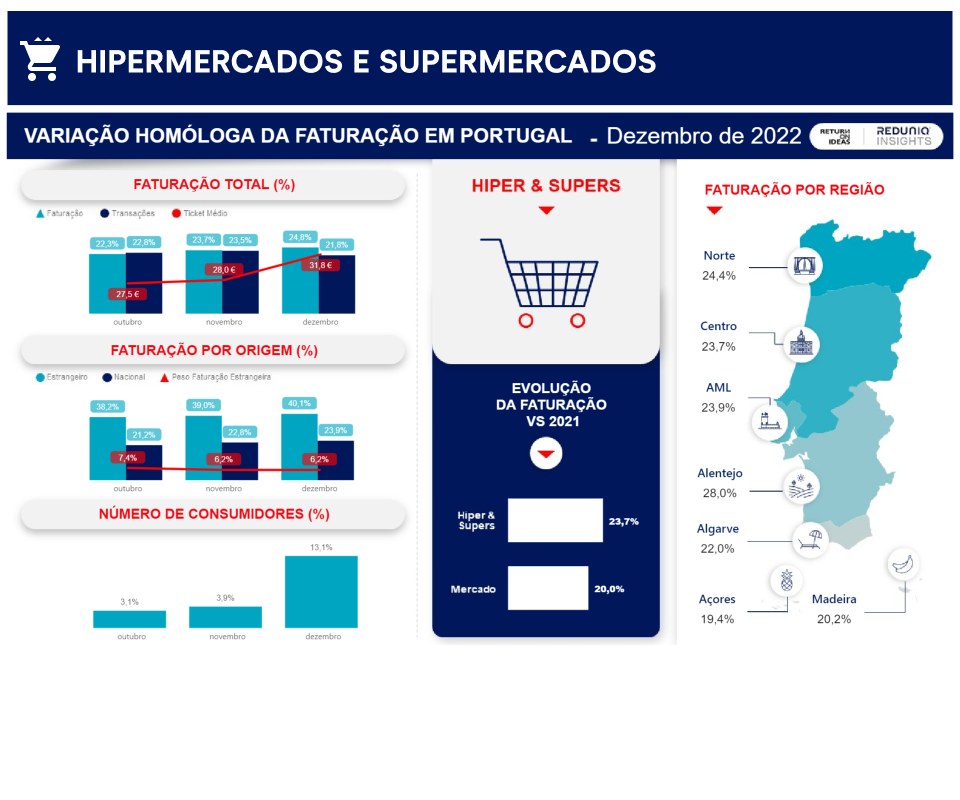
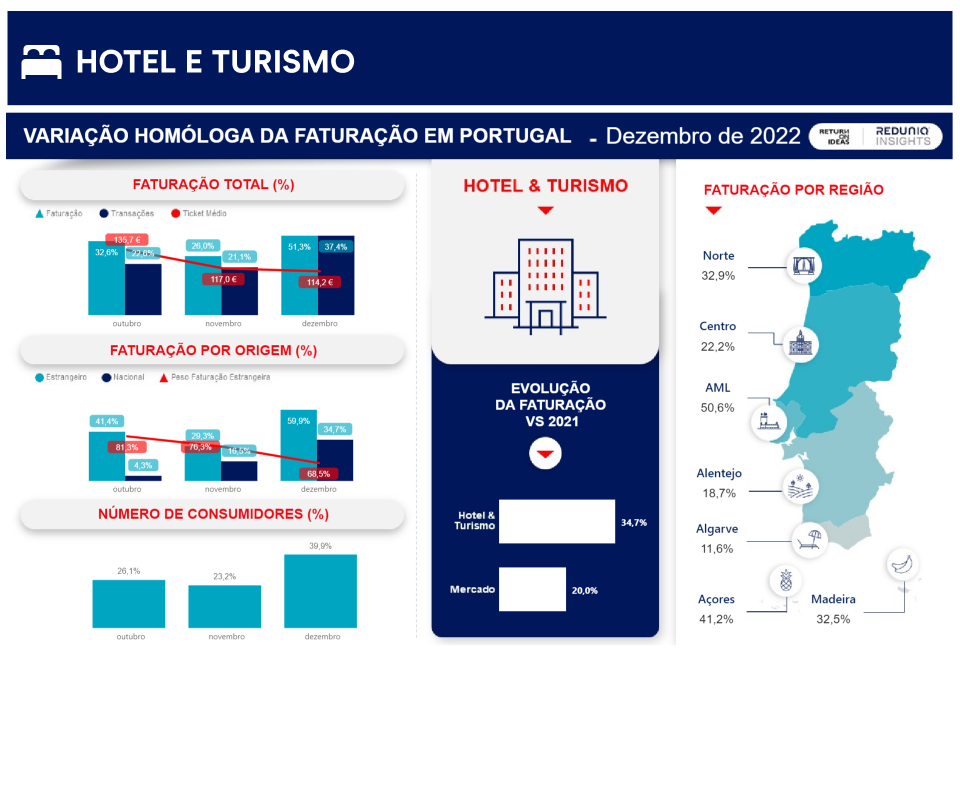
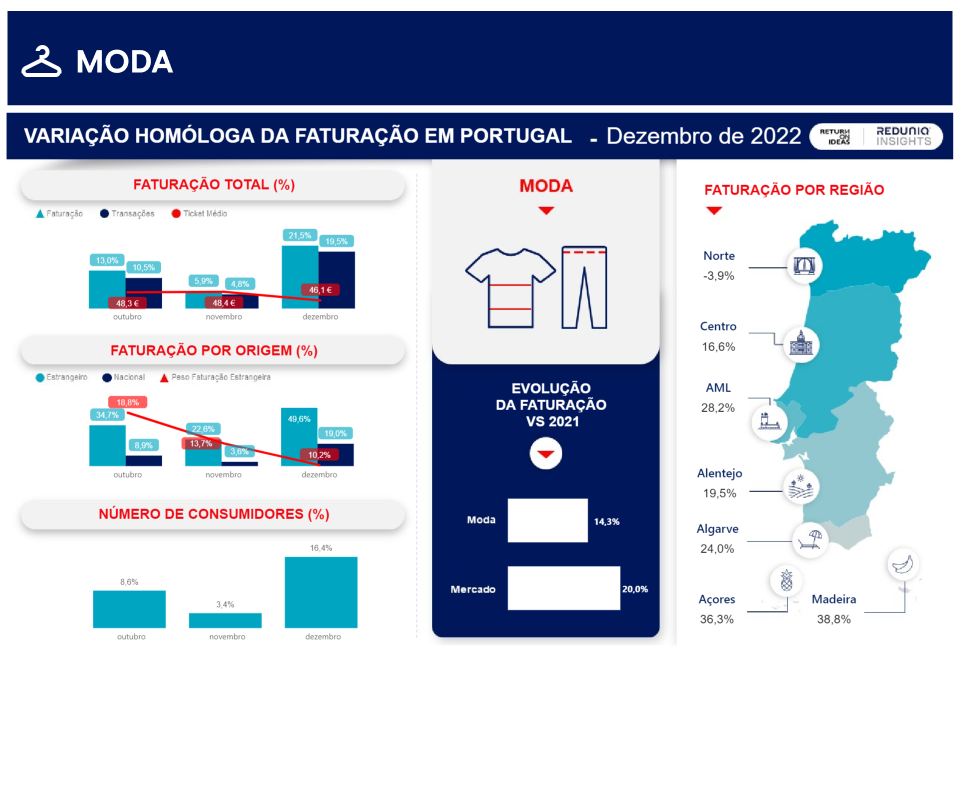
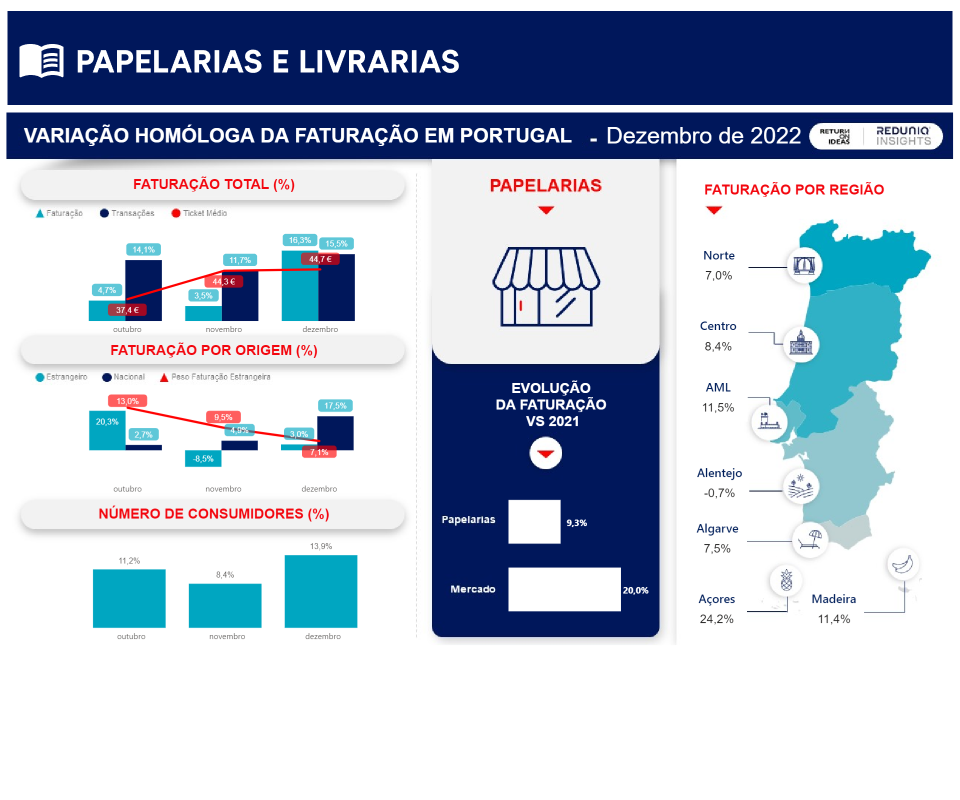
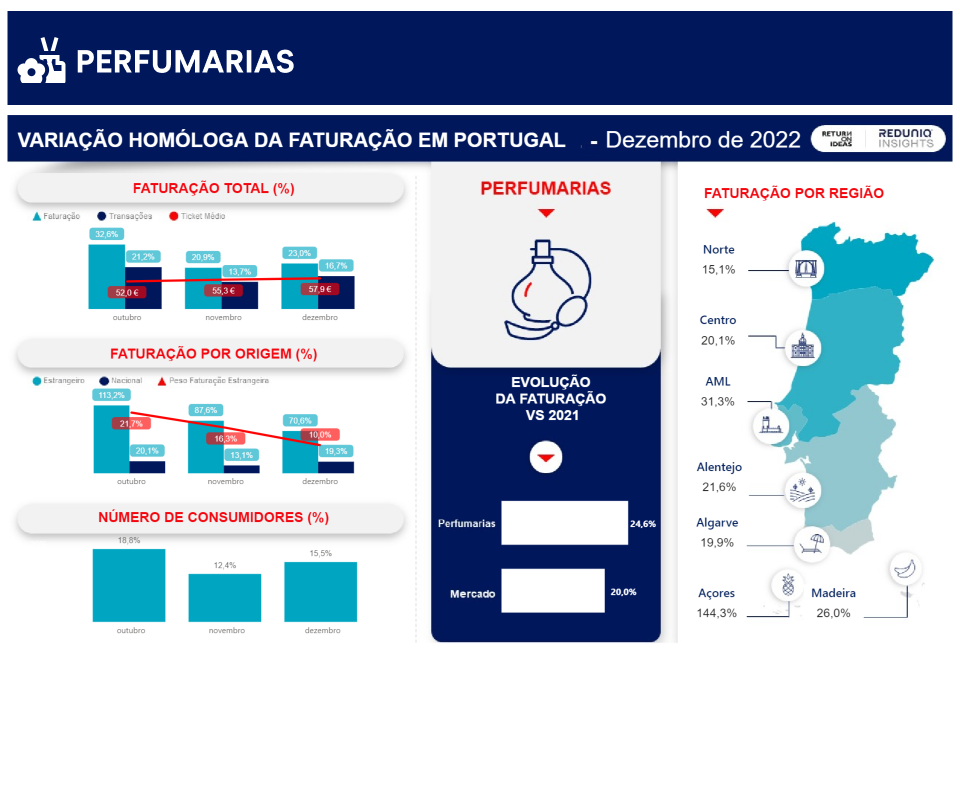
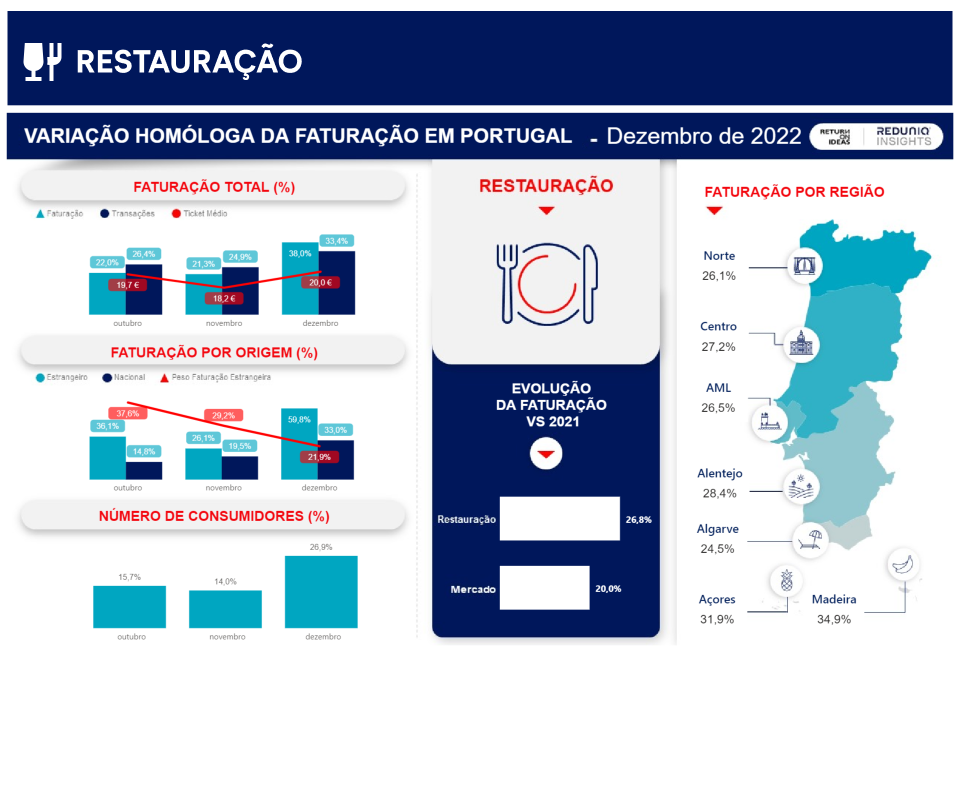
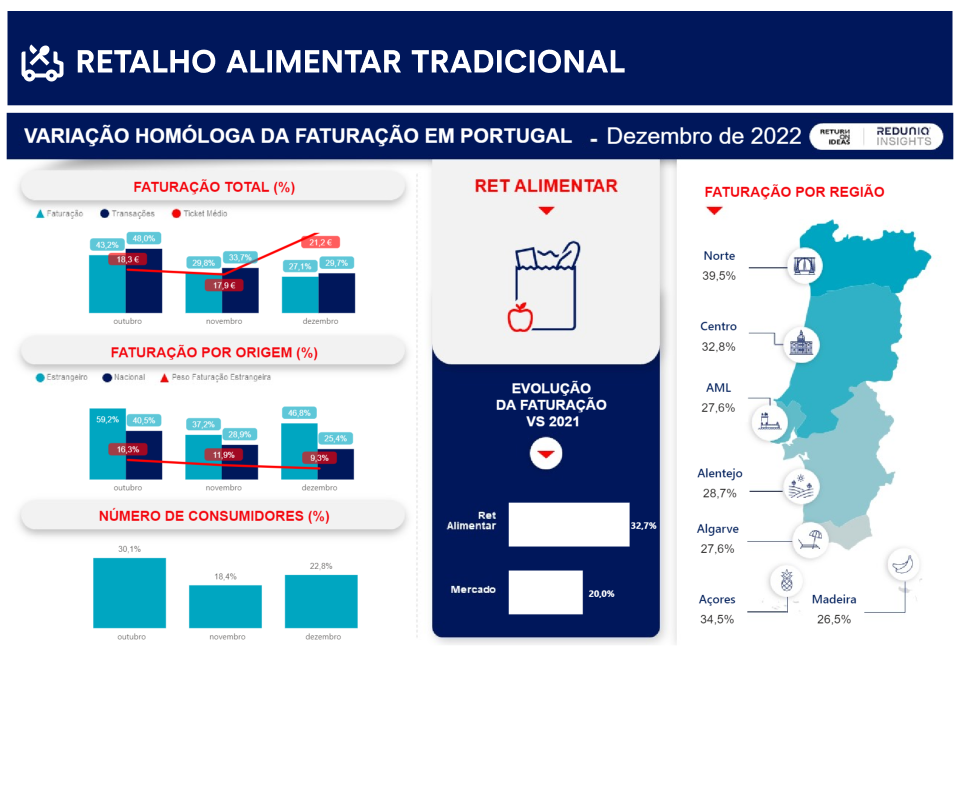
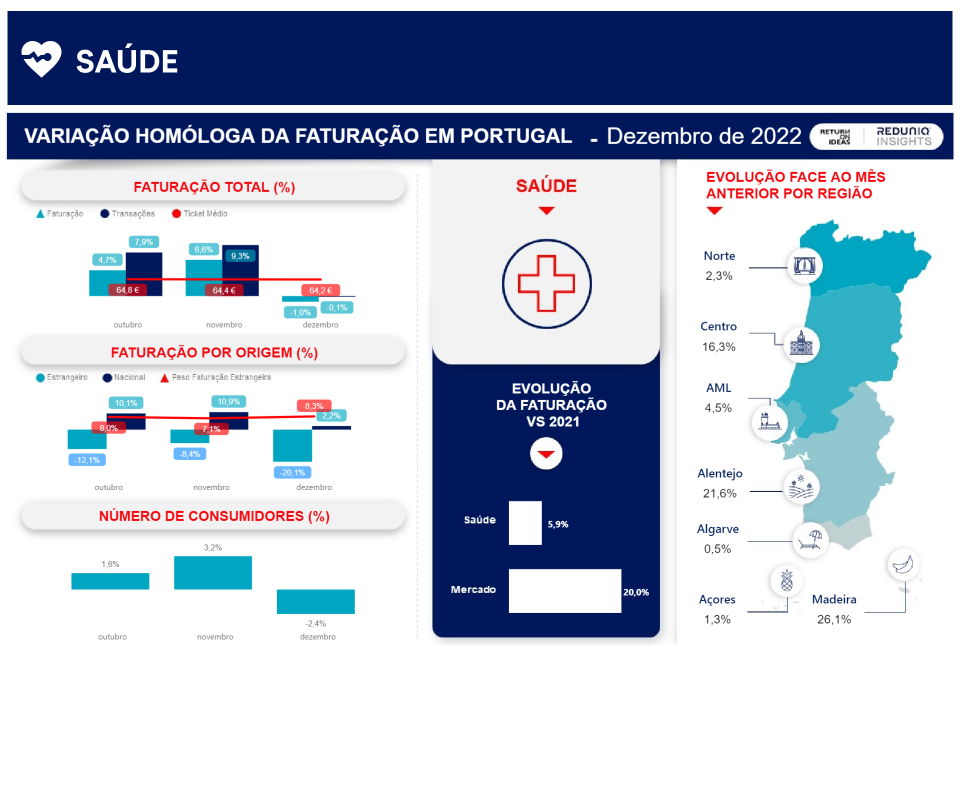
Follow the consumption behaviour of the previous month compared to the previous year, with national data, by region and by sector of activity.
Sector infographics
Receive a monthly report with data on a sector of activity, in your customer area, for just €4.99 + VAT per month.
Personalised reports
Receive a fully personalised report for your business. We'll carry out an analysis tailored to your business needs.
Free reports
Consult free analyses carried out regularly on the most important consumer moments at national level.
Free infographic
Sector infographics
Now you can receive a report with specific data on a sector of activity in your customer area for just €4.99 + VAT per month.
This product is available for a total of 13 sectors, so all you have to do is define the sector(s) that best suit your business!
If you don't have a Client Area yet, join now and start enjoying this service
Personalised reports
Free reports
The free reports analyse the dynamics and evolution of different sectors of activity and geographical areas at the most relevant times of the year. See our latest analysis for the year 2023.
The Year 2023 in a nutshell
In 2023, there was a growth of 10% in total turnover and 15% in transactions compared to 2022? The Hotel and Tourist Activities category stands out, where foreign turnover accounted for 77.5% of total turnover in 2023.

See other reports already made available by REDUNIQ.
REDUNIQ Insights report on the transactional variation during Easter.
REDUNIQ Insights report on the transactional change in business in 2023
REDUNIQ Insights report on the transactional variation of business over Christmas and New Year's 2023
REDUNIQ Insights report on the transactional change in business on Black Friday, compared to 2022
REDUNIQ Insights report on the transactional variation of business during 2023.
REDUNIQ Insights report on the transactional variation of business during the first half of 2023.
REDUNIQ Insights report on the transactional variation of business during 2022.
REDUNIQ Insights report on the transactional variation of businesses on Black Friday, compared to 2021
REDUNIQ Insights report on the transactional variation of business during the summer of 2022.
REDUNIQ Insights report on the transactional variation of business during the first half of 2022.
REDUNIQ Insights report on the transactional variation of business during 2021.
REDUNIQ Insights report on the transactional variation of business over the Christmas and New Year period, compared to pre-pandemic data.
REDUNIQ Insights report on the transactional variation of businesses on Black Friday, compared to pre-pandemic data.
REDUNIQ Insights report on the transactional variation in business this summer, with an emphasis on the tourism sector.
REDUNIQ Insights report on the impact of deconfinement on consumption, one year on.
REDUNIQ Insights Report on the 2nd General Confinement.
REDUNIQ Insights Report for 2020 and the 2nd General Lockdown enacted on 13 January 2021.
REDUNIQ Insights report on the State of Emergency period. 29 November to 12 December 2020.
REDUNIQ Insights report on the State of Emergency period. 15 to 28 November 2020.
REDUNIQ Insights report on the State of Emergency period. 1 to 14 November 2020.
REDUNIQ Insights report for summer 2020. Analysis up to 26 September 2020.
REDUNIQ Insights report on the period of deconfinement and first reopenings after the State of Emergency. 12 to 18 July 2020.
REDUNIQ Insights report on the period of deconfinement and reopenings after the State of Emergency. 14 to 20 June 2020.
REDUNIQ Insights report on the period of deconfinement and reopenings after the State of Emergency. 31 May to 6 June 2020.
REDUNIQ Insights Report on the period of deconfinement and first reopenings after the State of Emergency. 24 to 30 May 2020.
REDUNIQ Report Insights from the period of deconfinement. The shape of the crisis and the recovery. 17 to 23 May 2020.
REDUNIQ Insights report on the period of deconfinement and first reopenings after the State of Emergency. 10 to 16 May 2020.
REDUNIQ Insights report on the period of deconfinement and first reopenings after the State of Emergency. 3 to 9 May 2020.